www.it-connect.fr
Top 15 Essential Linux Commands for Network Administration and Troubleshooting
Table of Contents
I. Introduction
Discover 15 essential commands for command-line network management under Linux. Whether you want to display your network configuration, diagnose a connectivity problem, test a port or analyze network traffic, there are commands you need to know.
If you're new to Linux administration, want to improve your skills, or are simply looking for a memo of the network commands you need to know about Linux, you've come to the right place. This article covers a wide range of commands for different needs!
II. Linux: display network configuration
A. The ip a command
There was a time when it was necessary to use the "ifconfig". This was useful for displaying a machine's IP address, or simply for retrieving the network card name. This used to be useful for displaying a machine's IP address or simply retrieving the name of the network card. From now on, the "ip a" command, which is short for "ip addr show", must be used. It is part of the iproute2 collection of utilities.
This is the preferred method, and more importantly, the "ifconfig"command is no longer recognized (although this depends on the environment on which you're running the command). If the "ifconfig"cannot be found on a machine, you know why.
Examples of how to use the ip a command:
ip a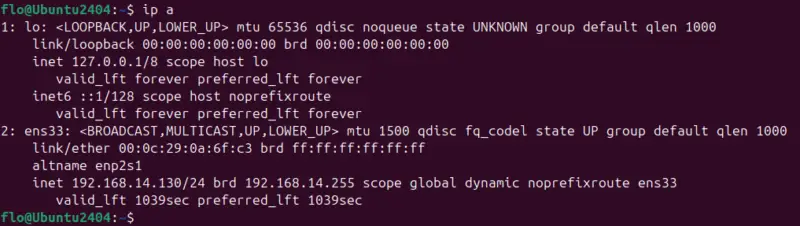
This simple call displays all network interfaces and their detailed information, including IPv4 and IPv6 addresses. If you wish to display information on a specific interface only, you can use this command:
ip a show <nom de l'interface>
ip a show ens33
ip a s ens33
B. The netplan command
When it comes to network management, there's also Netplan, a network configuration tool positioned above the"systemd-networkd" and"NetworkManager" network configuration managers. It's present by default on Ubuntu, and given the popularity of this system and the availability of Netplan on Debian, I feel it's important to mention it in this article.
At the very least, you need to be able to display Netplan's configuration when it is used to manage the network on a Linux machine.
Example of the netplan command:
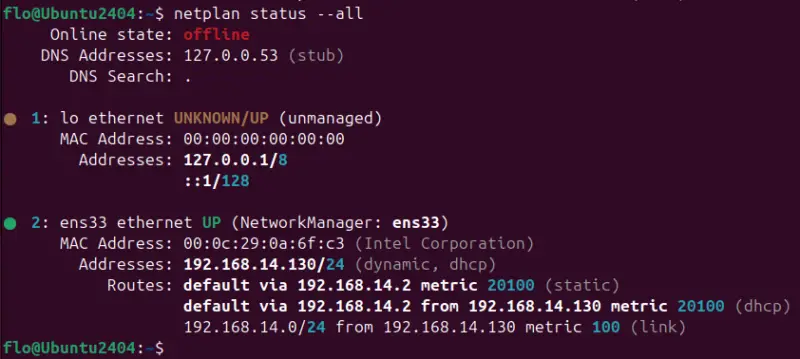
netplan status --allThis command displays the detailed configuration of all interfaces. MAC addresses are also specified, as are routes.
C. The ip route command
With "ip a" the default route used by the Linux machine is not displayed. To view and modify the routing table on Linux, and thus display the default route, you need to use the "ip route" command.
Examples of how to use the ip route command:
ip route showThis command displays the routes currently in use, including the default gateway and specific routes defined on the system.
To define a new default gateway, follow these steps. Here, the IP address"192.168.14.2" will be defined as the default gateway.
sudo ip route add default via 192.168.14.2If required, you can also specify the output interface, here"ens33" :
sudo ip route add default via 192.168.14.2 dev ens33III. Linux: testing network connectivity
A. The ping command
Do we still need to present the "ping" ? Both essential and basic, it is still very useful for first-level network diagnostics. The ping command sends a series of ICMP (Internet Control Message Protocol) packets to a destination host (IP address, name) to check whether it can be reached and measure response time.
Examples of how to use the ping command:
You can perform a simple ping by specifying the following command. By default, the ping is continuous on Linux, so you need to stop it with CTRL + C.
ping www.it-connect.fr
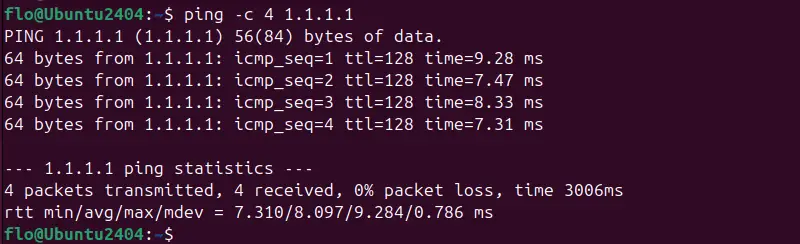
ping 1.1.1.1If you wish to limit the number of packets sent to four, you can use the "-c 4" option.
ping -c 4 1.1.1.1Which gives:
To force ping in IPv4 or IPv6, depending on your needs, you can use these options:
# IPv4
ping -4 www.google.fr

# IPv6
ping -6 www.google.fr
B. The traceroute command
The "traceroute" command displays the path taken by a packet to its destination, identifying each router traversed. If you can't reach a host, you can try to identify a blocking point by using this command. It can also help you understand where the fault lies on a network, in the event of a connectivity failure, although the non-response of some equipment may make analysis more difficult.
Examples of how to use the traceroute command:
traceroute 1.1.1.1If you do not have access to this command, you must install traceroute:
sudo apt update && sudo apt install tracerouteThe result is the route. However, when you run traceroute, asterisks (*) may appear in the console when the tool does not receive a response from an intermediate router (timeout). This may simply be due to filtering at equipment level.
By default, the traceroute uses UDP packets to determine the route. If a firewall filters these packets, you can try using the "-I" option to switch to ICMP packets:
sudo traceroute -I 1.1.1.1Alternatively, you can use the "-T" option to use TCP packets instead of UDP (and ICMP). However, the route can be determined less precisely.
sudo traceroute -T 1.1.1.1C. The mtr (My Traceroute) command
Behind the command "mtr" lies a tool called My Traceroute, which has the advantage of combining both the ping and the traceroute. Although used in console mode, its interface is clear and, above all, the data is updated in real time. The result is a more dynamic visualization of the network path taken.
Examples of how to use the mtr command:
mtr google.frA result like this is obtained:
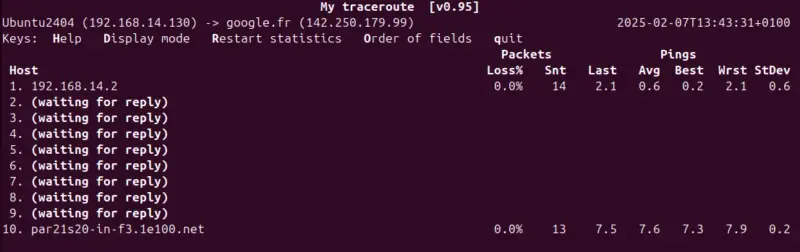
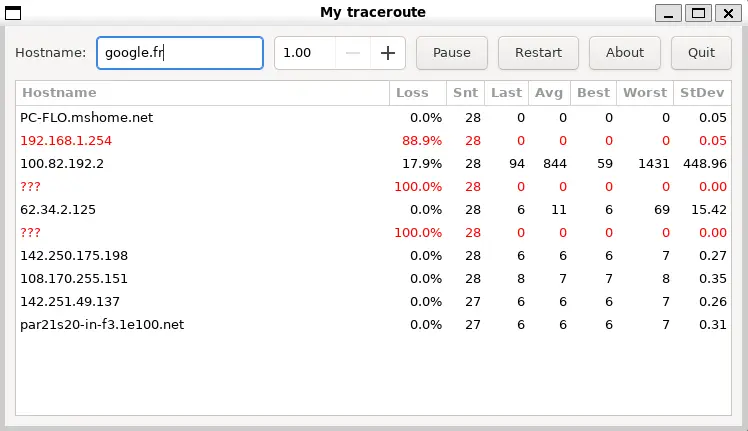
Here, the result contains little information, as there is filtering on the network. On another machine, however, I managed to obtain a much more realistic result. Below is the display of My Traceroute via WSL (it opens a small independent window with the results). By default, My Traceroute runs in interactive mode.
Here are some examples of how you can use My Traceroute to put certain options into practice.
# Limit the number of sent packets to 10
mtr -c 10 google.fr

# Display only statistics using report mode
# With 5 cycles instead of the default 10
mtr --report --report-cycles 5 google.fr

# Perform a test using TCP packets on port 443
mtr -T -P 443 google.fr

# Disable DNS resolution to display only IP addresses
mtr -n google.fr

# Install My Traceroute on Ubuntu / Debian
sudo apt-get install mtr
IV. Linux: analyzing network connections and traffic
A. The lsof command
The "lsof " command, whose name stands for "List Open Files", is a tool for displaying files opened by system processes, including active network connections.
Example of how to use the lsof command:
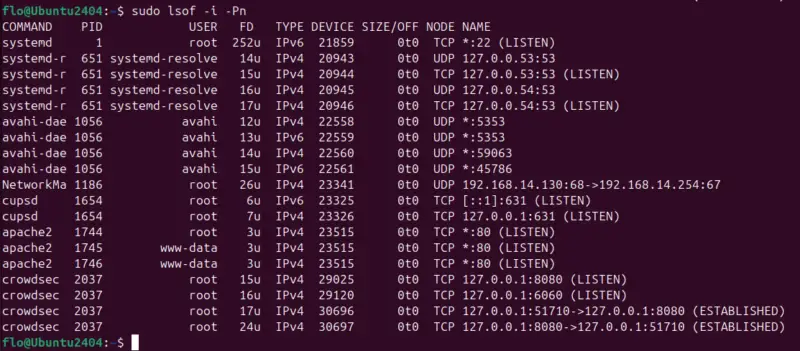
sudo lsof -i -PnLet's take this command apart to understand the advantages of each option:
- The "
-i" option displays open network connections. - The otpion "
-P" disables the resolution of port numbers to service names. - The "
-n" option prevents DNS resolution (increases execution speed)
B. The ss command
The ss command, whose name stands for"socket statistics", is a faster, more modern version of the netstat tool. It will therefore enable us to obtain information on network connections. The transition from netstat à ss is easy, since the same options are available.
Example of how to use the ss command:
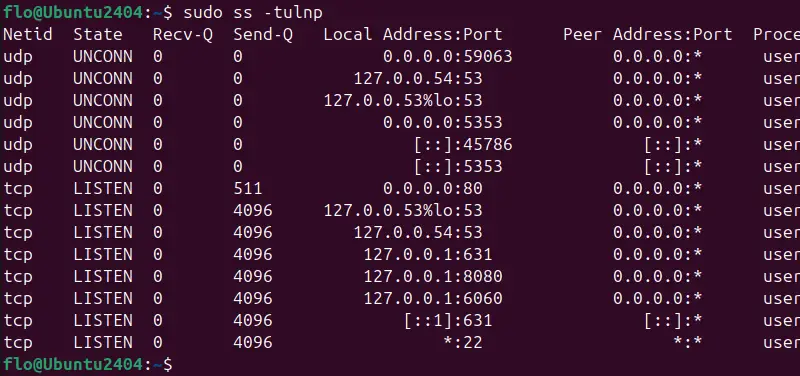
sudo ss -tulnpThis provides a detailed view of current network connections and associated processes. This is particularly useful for obtaining a list of listening ports on the local machine, by reading the"Local Address:Port" column.
Here are other examples of ss :
# List TCP sockets
ss -t

# List UDP sockets
ss -u

# List TCP sockets listening on source port 22 (SSH)
ss -tl "sport == :22"

# List TCP connections in a specific state (established, for example)
ss state established
Note : the
netstatalthough very useful and still popular today, is considered obsolete. For this reason, it has not been highlighted in this article.
C. The tcpdump command
The tcpdump tool, associated with a command of the same name, is very useful for capturing and analyzing network packets in real time. It is often used to diagnose network communication problems, examine incoming and outgoing traffic, or detect possible malicious flows. It's a kind of command-line alternative to Wireshark.
It includes numerous options for creating filters to capture only certain packets. For example, it can filter packets according to criteria such as IP address, port or protocol used.
Examples of tcpdump:
Let's start with the most basic example, but not necessarily the most practical. With this command, tcpdump captures and displays all packets on the ens33 interface, in real time.
sudo tcpdump -i ens33You can stop capture at any time with the keyboard shortcut CTRL + C.
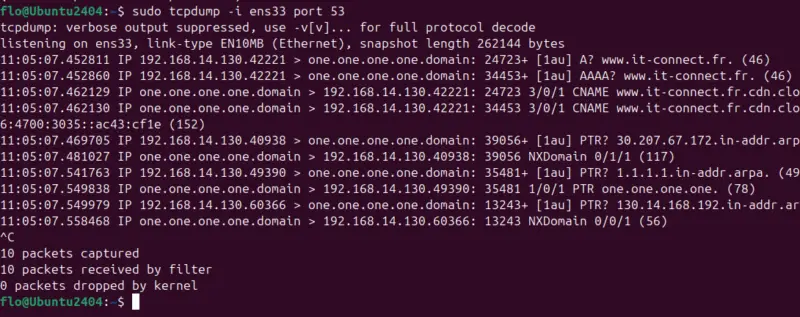
To capture only DNS requests with tcpdump, you can use the following command to add a filter on port 53 :
sudo tcpdump -i ens33 port 53The image below shows DNS exchanges between the local machine and a DNS server, in this case server 1.1.1.1.
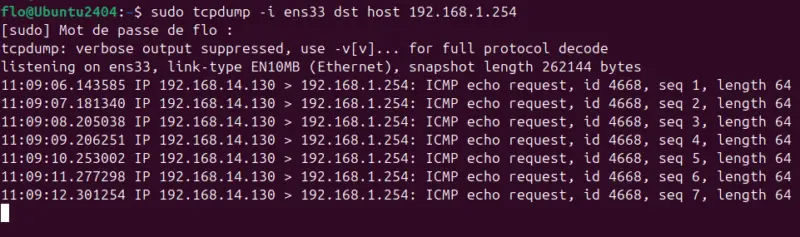
We could also capture only packets exchanged with the host whose IP address is 192.168.1.254. To do this, we add a filter based on the dst host.
sudo tcpdump -i ens33 dst host 192.168.1.254Here we can see that ICMP packets (ping) are exchanged between the two machines:
Note : you can couple the use of
tcpdumpwithgrepto refine packet capture output in real time.
V. Linux: diagnosing DNS resolution
A. The nslookup command
The nslookup command, also found on other OSes such as Windows, can be used to query a DNS server to obtain the IP address associated with a domain name (or vice versa). Here are a few examples of how this command can be used:
- Resolution of a domain name into an IP address.
- Query a specific DNS server for resolution.
- Obtain DNS records (MX, CNAME, TXT, etc.).
- Test reverse resolution (PTR records) to obtain the domain name associated with an IP address.
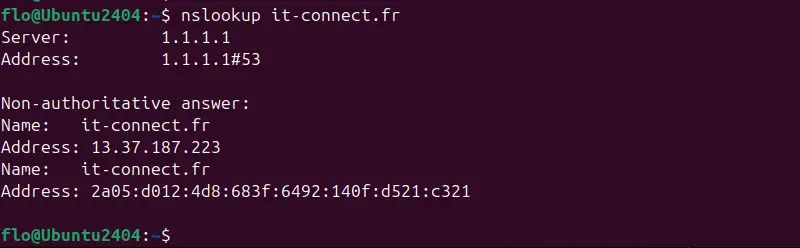
Examples of nslookup:
nslookup it-connect.frThis returns the IP address corresponding to the it-connect.fr domain. The answer may vary, especially when the website is behind a solution like Cloudflare. Beyond the response, we also know which DNS server was queried, in this case server 1.1.1.1.
To query a specific DNS server, simply specify its IP address, after the host name to be resolved.
nslookup it-connect.fr 8.8.8.8You can also consult specific records, such as those of type"TXT", which provide more specific information (on SPF, for example).
nslookup -query=TXT it-connect.frIf nslookup is not installed on your machine, you can obtain it from the official repositories. On Ubuntu and Debian, these commands will suffice:
sudo apt update && sudo apt install dnsutilsB. The dig command
When it comes to diagnosing a DNS problem or obtaining information about a host, the "dig" command is also very interesting. This tool, whose name stands for "Domain Information Groper", is a veritable Swiss army knife for performing DNS queries.
Compared to nslookupthe tool dig provides more detailed information on a domain's DNS records. It is particularly used to precisely analyze DNS server responses.
Examples of dig:
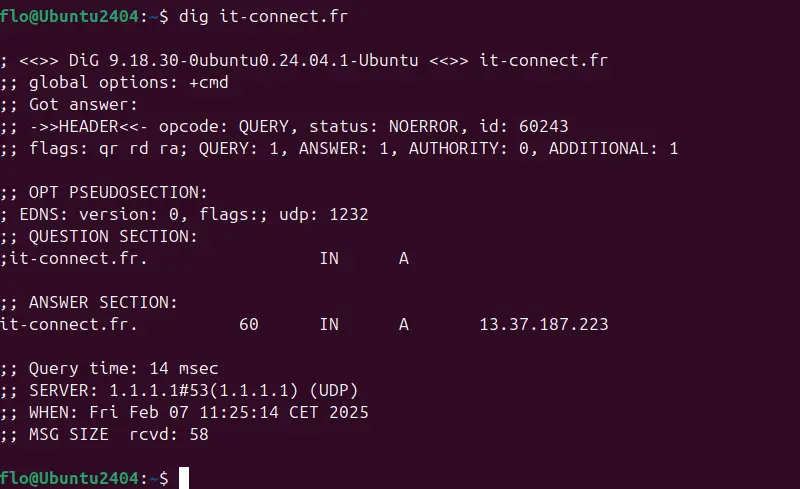
It can be used as simply as nslookup, where you simply specify the hostname to be resolved.
dig it-connect.frThis command displays the DNS record corresponding to the targeted domain, along with the response time and the DNS server requested.
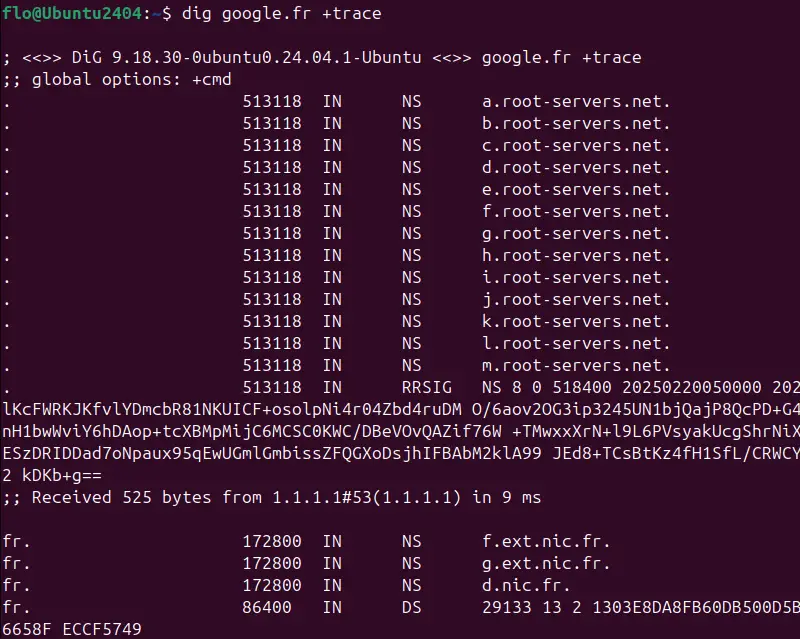
An example of a command dig that you can't do with nslookup is the request to display the complete DNS resolution string! To do this, simply add the "+trace" option like this:
dig google.fr +traceThis command allows you to follow all stages of DNS resolution (i.e. all responses), from the root servers to the domain's final name server. The output shows first the request sent to the root server, then the path followed through the successive name servers until the domain is fully resolved. Below is an overview of the result, which can be used to diagnose a DNS propagation problem.
Here are some other practical examples of how to use this command:
# Query a specific DNS server (here 8.8.8.8)
dig @8.8.8.8 it-connect.fr

# Specify the type of records to retrieve (A, AAAA, CNAME, TXT, etc.)
dig it-connect.fr txt

# Resolve multiple hostnames at the same time
dig it-connect.fr google.fr

# Display only the DNS query response (e.g., the IP address)
dig +short it-connect.fr
VI. Linux: scanning and testing ports
A. The netcat tool and the nc command
Netcat, often abbreviated to "nc" as the name suggests, this is a versatile tool capable of performing a wide range of tasks. In fact, it can be used in a wide variety of applications, including :
- Scan ports for open ones
- Test the opening of a port on a remote machine.
- Listen on a port in server mode to receive connections.
- Establish a TCP/UDP connection to a remote host.
- Transfer files between two machines.
- Etc....
Examples of nc:
Let's start by using netcat to see if port 3389 is open on a machine:
nc -zv serveur.it-connect.local 3389The "-z"The first option is used to perform port scans, while the second option corresponds to verbose mode. If the connection is successful, the following message will be returned:
Connection to serveur.it-connect.local 3389 port [tcp/ms-wbt-server] succeeded!If the port is not open, a message similar to the following will be returned:
nc: connect to serveur.it-connect.local port 3389 (tcp) failed: Connection timed outTo scan a range of ports, you can use this syntax (from 10 to 1000, here):
nc -zv serveur.it-connect.local 10-1000The test result for each port will be displayed in the console. To set a customized timeout, use the " -w" with a value in seconds following. Here's an example:
nc -zv serveur.it-connect.local 10-1000 -w 3Find out more about how to use the nc command:
# Transfer a file between two machines
# Receiving side: listen on port 2025
nc -lvp 2025 > data.txt

# Sending side: send the contents of a file to 192.168.14.130:2025
cat file.txt | nc 192.168.14.130 2025

# Test an SMTP server by sending a command
nc smtp.it-connect.fr 25

# Initiate a shell between two machines
# Receiving side (machine to connect to) on port 2025
nc -lvp 2025 -e /bin/bash

# Sending side: machine from which commands are executed
nc 192.168.14.99 2025
The examples above show that it's even possible to launch a shell between two machines with netcat ! This versatile command should therefore be used responsibly and ethically.
B. The nmap tool
Do we still need to introduce the Nmap tool? Especially on IT-Connect, where we have published a complete course on how to use Nmap. This is a powerful tool for performing port scans, detecting machines connected to a network and even searching for vulnerabilities. It is used with a command simply named "nmap ", which supports a wide range of parameters.
Examples of nmap:
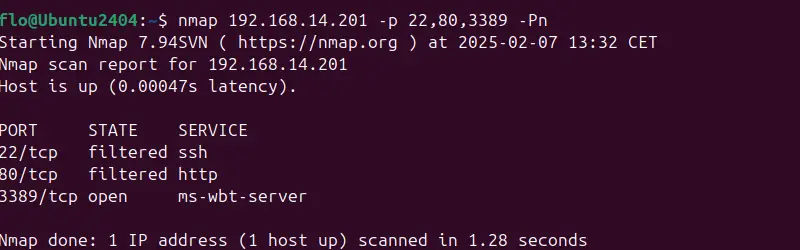
The example below is useful for scanning ports 80, 22 and 3389 on one machine. We could also scan several machines, an entire network, or even a range of ports.
nmap 192.168.14.201 -p 22,80,3389
# ou
nmap 192.168.14.201 -p 22,80,3389 -Pn
Here, port 3389 appears to be open on the machine analyzed, unlike the other two ports tested.
Below you'll find more examples of how this tool can be used, but that's just a small sample of the possibilities it offers. If you'd like to learn more, take a look at our course.
# Scan all ports of a machine (1-65535)
nmap -p- server.it-connect.local

# Scan the 100 most commonly used TCP ports
nmap server.it-connect.local --top-ports 100

# Detect hosts on a full network with a Ping Scan
nmap -sP 192.168.10.0/24

# Detect versions on the host
nmap -sV server.it-connect.local
VII. Linux: testing bandwidth
A. The iperf command
The "iperf" command corresponds to a network bandwidth measurement tool used to evaluate the performance of a connection by generating traffic between two machines. The iperf tool is therefore required on both machines.
As a reminder, three fundamental characteristics determine the quality of a link:
- latency (also known as response time and abbreviated as RTT) is usually measured with a ping command.
- Jitter (also known as latency variation).
- Packet loss.
Examples of how to use the iperf :
The first step is to install the tool on each machine:
sudo apt update && sudo apt install iperfThen listen to the first machine that will receive the traffic (server):
iperf -sThen, on the client machine (which sends traffic to the server), run this command:
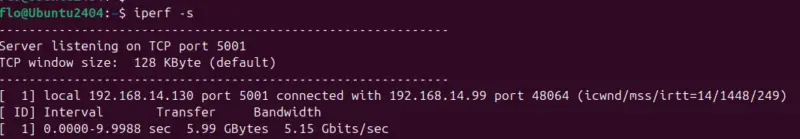
iperf -c <server IP address>
iperf -c 192.168.14.130
In this way, we obtain a result like the one shown in the image below. It shows that the iperf server is listening on TCP port 5001 and has received a connection from a client machine (192.168.14.99). The throughput test lasted around 10 seconds, transferring 5.99 GB of data at a rate of 5.15 Gbit/s. This result shows the bandwidth available between the two machines, using a TCP connection!
Here are some other examples of how to use this tool to avoid using the default options:
# Run a bidirectional test to measure performance in both directions
iperf -c 192.168.14.130 -d

# Run a throughput test in parallel with 4 simultaneous streams
iperf -c 192.168.14.130 -P 4

# Run a test for a defined duration (30 seconds)
iperf -c 192.168.14.130 -t 30

# Run a UDP throughput test (client / server)
iperf -s -u
iperf -c 192.168.14.130 -u
B. The speedtest command
Are you familiar with Ookla's Speedtest service? Well, there's a command-line tool simply called speedtest-cli that lets you measure the speed of your Internet connection. This speed test is based on Ookla's services.
Example of speedtest-cli:
Start by installing the tool on your machine using the official commands provided on the Speedtest website.
sudo apt-get install curl
curl -s https://packagecloud.io/install/repositories/ookla/speedtest-cli/script.deb.sh | sudo bash
sudo apt-get install speedtest
You can then run a flow test with this command:
speedtestThis launches a download and upload speed test by polling the nearest server. You can explore the options to select the Speedtest server of your choice, notably via the " -L"to list available servers.
VIII. Conclusion
These 15 commands cover a wide range of needs for network administration under Linux, but also for diagnosing a network-related problem! Mastering these tools and commands is a good starting point for any network administrator or sysadmin who wants to be at ease under Linux.
What do you think? Would you have liked to see other orders added to this list? We look forward to hearing from you!