www.it-connect.fr

How to generate HTML reports with PowerShell?
Table of Contents
I. Introduction
PowerShell is fully capable of manipulating data in a variety of formats and languages, and HTML is one of those supported. In this tutorial, we'll look at how you can take advantage of this to create reports in HTML format.
The advantage of using HTML for reports is that it allows information to be structured and presented in a readable and interactive way. We're going to explore two main methods for generating HTML reports: using the ConvertTo-Html and the use of the PSWriteHTML module, which offers greater flexibility and customization.
II. Using the ConvertTo-Html cmdlet
The cmdlet ConvertTo-Html is a native PowerShell solution for transforming objects into HTML code. It's easy to use at first glance, but if you want to go further, you'll need to know HTML syntax and CSS (for formatting).
A. Export order results in HTML format
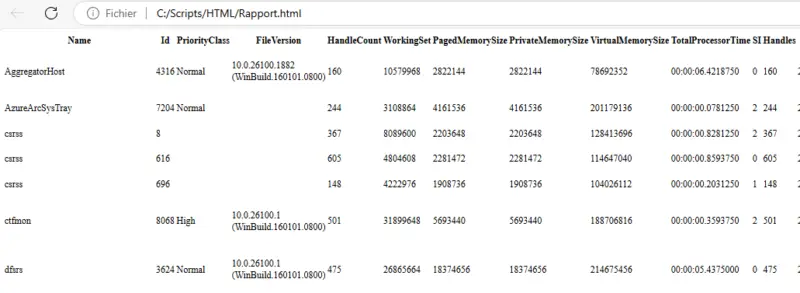
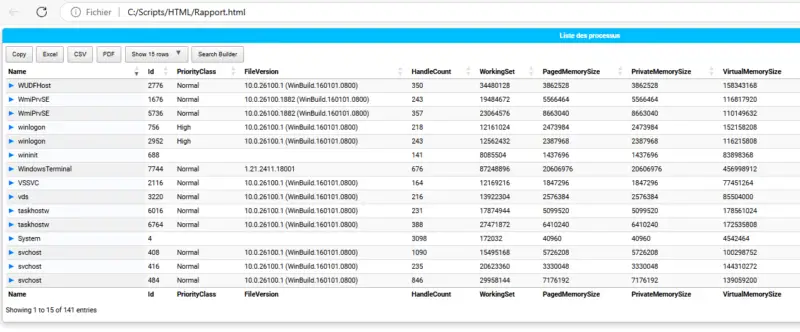
In this example, the ConvertTo-Html is used to export the list of running processes in an HTML table. The result is saved in a file named "Rapport.html".
Get-Process | ConvertTo-Html | Out-File "C:\Scripts\HTML\Rapport.html"If you run this command, you'll get the result shown below, i.e. a raw HTML table, with no formatting effort whatsoever. In other words, there's no CSS code to add a bit of color or anything.
Here is the result obtained:
Note : CSS(Cascading Style Sheets) is a style language used to define the appearance and layout of HTML elements on a web page.
B. Add a title to the page
You can add a title to the HTML page using the parameter -Title. This title will be visible in the browser, in the tab corresponding to the HTML file.
Get-Process | ConvertTo-Html -Title "Liste des processus" | Out-File "C:\Scripts\HTML\Rapport2.html"In concrete terms, this parameter will adapt the HTML code to add this piece of code:
<head>
<title>Liste des processus</title>
</head>
C. Adding CSS style
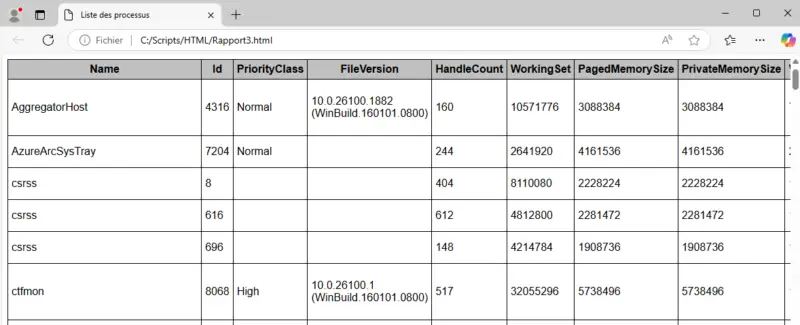
Now, in place of the title, we're going to add CSS code to improve the display of our table in HTML format. This will improve readability and the overall view of our table. The parameter -PreContent allows you to insert elements before the table, in this case the equivalent of a CSS style sheet integrated into the HTML code. You'll need some basic knowledge of CSS and HTML to be able to improve the table's formatting, but it's not very complicated.
$Style = "<style> body { font-family: Arial; } table { width: 100%; border-collapse: collapse; } th, td { border: 1px solid black; padding: 5px; } th { background-color : #C0C0C0 }</style>"

Get-Process | ConvertTo-Html -Title "Liste des processus" -PreContent $Style | Out-File "C:\Scripts\HTML\Rapport3.html"
This time, the picture is easier to interpret. Here is the result obtained:
Here are a few explanations to help you interpret the CSS code:
body { font-family: Arial; }sets the document's global font to Arialtable { width: 100%; border-collapse: collapse; }makes the table 100% wide and merges the borders to avoid double lines.th, td { border: 1px solid black; padding: 5px; }adds a 1-pixel black border (thickness) and 5px padding to cellsth(header) andtd(column)th { background-color : #C0C0C0; }applies a light gray background (#C0C0C0) to header cells (th).
Note: you can also use the "-PostContent" parameter to add content after the table, in the HTML output file. This can be useful for adding a statement, logo, etc.
III. Building a custom HTML file
To go a step further and make this table easier to read, we can add a little color to it. For example, to highlight certain rows according to a specific criterion. In this case, the idea is to add specific CSS code (static code or a CSS class call) to modify the appearance of the rows concerned.
You can also use the ConvertTo-Html then modifying the generated HTML code to inject CSS code in the right places. See this script for an example (line 269 to 289). Another way of doing things is to build the HTML code ourselves, since the structure of this language is quite simple. This is what we're going to see.
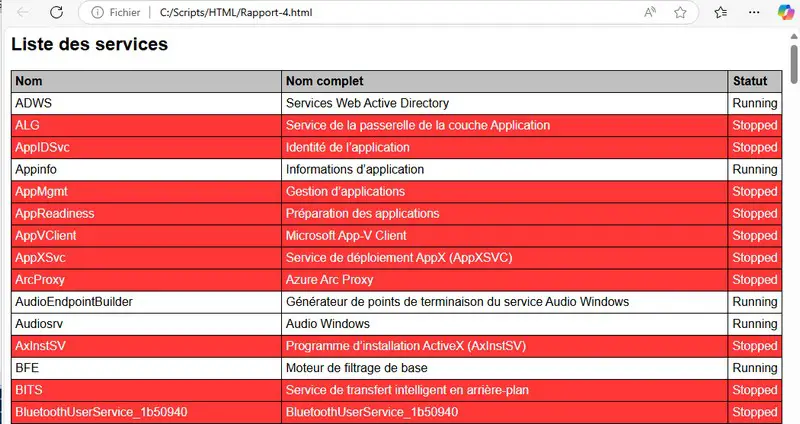
The aim is to export the list of services on the local machine and add red as a background color on all lines where the service is currently stopped.
We'll start by declaring our CSS code, formatting it so that it's easier to read and modify (unlike the previous example). You'll notice the CSS class .stopped which will apply to lines where service is discontinued.
# Define the CSS style
# The .stopped class will be applied to all rows where the service is stopped
$Style = @"
<style>
    body { font-family: Arial, sans-serif; }
    table { width: 100%; border-collapse: collapse; }
    th, td { border: 1px solid black; padding: 5px; text-align: left; }
    th { background-color: #C0C0C0; }
    .stopped { background-color: #FF3737; color: white; }
</style>
"@
Next, we retrieve the list of services by selecting three properties (this is important, as we'll need the HTML code later), namely NameDisplayName and Status. Using a ForEach loop, we build a table in HTML format (without the header line).
# Retrieve the list of services and inject the CSS class when necessary
$HTMLTable = Get-Service | Select-Object Name, DisplayName, Status | ForEach-Object {
    $class = if ($_.Status -eq "Stopped") { "class='stopped'" } else { "" }
    "<tr $class><td>$($_.Name)</td><td>$($_.DisplayName)</td><td>$($_.Status)</td></tr>"
}
Finally, we need to assemble our table code with a traditional HTML structure. The line " <tr><th>Nom</th><th>Nom complet</th><th>Statut</th></tr>" is to declare the header line of our table, respecting the list of properties selected previously (via Get-Service).
# Build the final file in HTML format
$HTML = @"
<html>
<head>$Style</head>
<body>
    <h2>Liste des services</h2>
    <table>
        <tr><th>Nom</th><th>Nom complet</th><th>Statut</th></tr>
        $($HTMLTable -join "`n")
    </table>
</body>
</html>
"@

# Export to a file
$HTML | Out-File "C:\Scripts\HTML\Rapport-4.html"
Here is the complete PowerShell script:
# Define the CSS style
# The .stopped class will be applied to all rows where the service is stopped
$Style = @"
<style>
    body { font-family: Arial, sans-serif; }
    table { width: 100%; border-collapse: collapse; }
    th, td { border: 1px solid black; padding: 5px; text-align: left; }
    th { background-color: #C0C0C0; }
    .stopped { background-color: #FF3737; color: white; }
</style>
"@

# Retrieve the list of services and inject the CSS class when necessary
$HTMLTable = Get-Service | Select-Object Name, DisplayName, Status | ForEach-Object {
    $class = if ($_.Status -eq "Stopped") { "class='stopped'" } else { "" }
    "<tr $class><td>$($_.Name)</td><td>$($_.DisplayName)</td><td>$($_.Status)</td></tr>"
}

# Build the final file in HTML format
$HTML = @"
<html>
<head>$Style</head>
<body>
    <h2>Liste des services</h2>
    <table>
        <tr><th>Nom</th><th>Nom complet</th><th>Statut</th></tr>
        $($HTMLTable -join "`n")
    </table>
</body>
</html>
"@

# Export to a file
$HTML | Out-File "C:\Scripts\HTML\Rapport-4.html"
What about the end result? Take a look at the HTML file obtained after running the script.
In the rest of this article, we'll look at how to use the PSWriteHTML module.
Note : it is possible to build beautiful HTML reports by generating the code yourself and adapting the CSS. However, this is more time-consuming than the method we'll discuss in the rest of this article.
IV. Getting started with PSWriteHTML
PSWriteHTML is a PowerShell module designed for those who want to create beautiful HTML reports without knowing HTML or CSS. It can also be used to further customize HTML reports by integrating interactive tables, graphs and other visual elements.
It was created by EvotecIT, along with other excellent modules such as CleanupMonster and GPOZaurr. By the way, both these modules rely on PSWriteHTML to create HTML reports.
A. Installing PSWriteHTML
To install the PSWriteHTML module, simply run the following command in a PowerShell console:
Install-Module -Name PSWriteHTML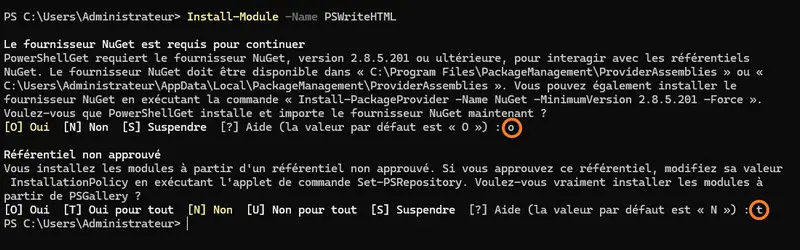
B. Main PSWriteHTML commands
You can list all the module's commands in this way:
Get-Command -Module PSWriteHTMLAt present, there are 196 PowerShell cmdlets in this module, so there's plenty to do!
Some essential commands in this module :
- New-HTML: creates an HTML document.
- New-HTMLTable: adds a table to the report.
- New-HTMLHeader: adds a header to the report (useful for indicating a report name, a company name, adding a logo, etc.).
- New-HTMLChart : adds a chart.
- New-HTMLSection : allows you to structure the report in sections (split a page into sections)
- New-ChartDonut: add a pie chart (or camembert chart, for the Normans)
C. Creating your first report with PSWriteHTML
Here is a simple example of an interactive report with PSWriteHTML :
New-HTML -Title "Rapport PowerShell" -FilePath "C:\Scripts\HTML\Rapport.html" {
    New-HTMLSection -HeaderText "Liste des processus" {
        New-HTMLTable -DataTable (Get-Process)
    }
}
This script generates an HTML report containing an interactive table displaying the list of running processes. It is heavier to run than a simple ConvertTo-Html but the result is not comparable. Here is the resulting HTML report:
It provides access to additional functions:
- Sort by column name with a single click
- Export results (PDF, CSV, Excel)
- Click on a process to get more details about it
- Search using the search bar
Let's see how to go further...
D. Create an HTML report with graphics
The PSWriteHtml module integrates numerous PowerShell cmdlets for customizing the HTML report, in particular for integrating a menu and thus navigating between several pages. You can also create tables and graphs of all kinds. You can create sections within the report, and each section can contain one or more elements.
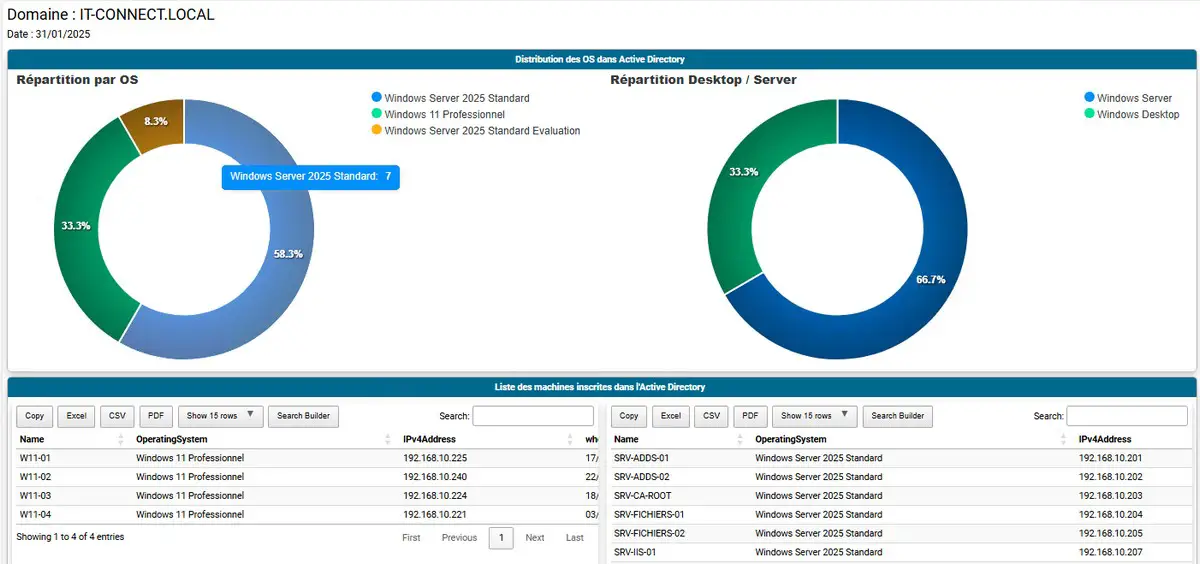
Below is an example of a report with information on machines integrated into the Active Directory domain. It contains the following elements:
- A header with the Active Directory domain name and the current date
- A first section with two graphs
- OS distribution of machines in the AD domain
- Breakdown of AD domain machines by Desktop / Server OS type
- A second section with two tables
- The list of workstations integrated into the domain
- The list of servers integrated into the domain
Now, let's take a closer look at the PowerShell code that achieves this goal.
Here's the first part of the script to retrieve data on domain machines. It's a simple code based on the use of Get-ADComputer of the Active Directory module. The idea is to store information in variables, which can then be displayed in the form of graphs or tables.
# Data Retrieval

# Store the list of computers present in AD
$ComputersList = Get-ADComputer -Filter * -Properties Name, OperatingSystem, whenCreated, IPv4Address

# Count occurrences of each OS
$ComputersOSName = $ComputersList | Group-Object -Property OperatingSystem | Sort-Object Count -Descending

# Classify OS with a calculated property
$ComputersOSType = $ComputersList | Select-Object OperatingSystem, @{
                        Name="TypeOS";
                        Expression={
                            if ($_.OperatingSystem -match "Windows Server") { "Windows Server" }
                            else { "Windows Desktop" }
                        }
                    } | Group-Object -Property TypeOS | Sort-Object Count -Descending

# Properties to export for machine tables
$ComputersOSProperties = @("Name", "OperatingSystem", "IPv4Address", "whenCreated")

# Get the list of workstations
$ComputersOSDesktop = $ComputersList | Select-Object $ComputersOSProperties | Sort-Object Name | Where-Object { $_.OperatingSystem -NotMatch "Server" }

# Get the list of servers
$ComputersOSServer = $ComputersList | Select-Object $ComputersOSProperties | Sort-Object Name | Where-Object { $_.OperatingSystem -Match "Windows Server" }
In the code above, the use of Group-Object -Property TypeOS is interesting, because it allows you to group AD machines by OS type, along with the number of elements. Handy for graphing!
Now we come to the code based on PSWriteHtml to build the HTML report.
# Building the HTML report with PSWriteHTML
New-HTML -Title "Répartition des OS" -FilePath "C:\Scripts\HTML\RapportOS-2.html" -ShowHTML:$true {

    # Report header with domain name and date
    New-HTMLHeader {
        New-HTMLSection -Invisible  {
            New-HTMLPanel -Invisible {
                New-HTMLText -Text "Domaine : $($env:USERDNSDOMAIN)" -FontSize 18 -FontWeight 100
                New-HTMLText -Text "Date : $(Get-Date -Format "dd/MM/yyyy")" -FontSize 12
            } -AlignContentText left
        }
    }

    # Section 1 - Graphs
    New-HTMLSection -HeaderText "Distribution des OS dans Active Directory" -HeaderBackGroundColor "#00698e" {
        New-HTMLChart -Title "Répartition par OS" -Gradient {
            foreach ($Line in $ComputersOSName) {
                New-ChartDonut -Name  $Line.Name -Value $Line.Count
            }
        }
        New-HTMLChart -Title "Répartition Desktop / Server" -Gradient {
            foreach ($Line in $ComputersOSType) {
                New-ChartDonut -Name $Line.Name -Value $Line.Count
            }
        }
    }

    # Section 2 - Tables with the list of computers
    New-HTMLSection -HeaderText "Liste des machines inscrites dans l'Active Directory" -HeaderBackGroundColor "#00698e"  {
            New-HTMLPanel {
                New-HTMLTable -DataTable $ComputersOSDesktop -HideFooter -AutoSize
            }
            New-HTMLPanel {
                New-HTMLTable -Title "Liste des postes des serveurs" -DataTable $ComputersOSServer -HideFooter -AutoSize
            }
    }
}
The idea is as follows:
- You need to declare a new HTML report with the
New-HTML - The -ShowHTML:$true option in the New-HTML cmdlet is used to open the report automatically once it has been generated.
- You must declare the header with the
New-HTMLHeader - Each new section (block with several elements inside) is declared via the
New-HTMLSection - Next, you need to nest the elements with one another in a hierarchical fashion (which allows you to mentally visualize the report layout). That's why, under the HTML report declaration, there's a section declaration, and under the section, there's the declaration of the two graphs.
Each cmdlet has its own options, for adjusting formatting, adding a title, modifying CSS, etc... It's very flexible and customizable. This example shows the potential of this PowerShell module and the ease with which data can be retrieved and formatted in a report.
Find the full script on the IT-Connect GitHub :

V. Conclusion
As we've just seen, PowerShell offers several possibilities for generating HTML reports, from the simple ConvertTo-Html to the more advanced PSWriteHTML. I strongly recommend using PSWriteHTML if you want more interactive and aesthetically pleasing reports, which are also a little heavier to generate. They also create a dependency on the PSWriteHTML module, unlike using the native PowerShell cmdlet.
What do you think?